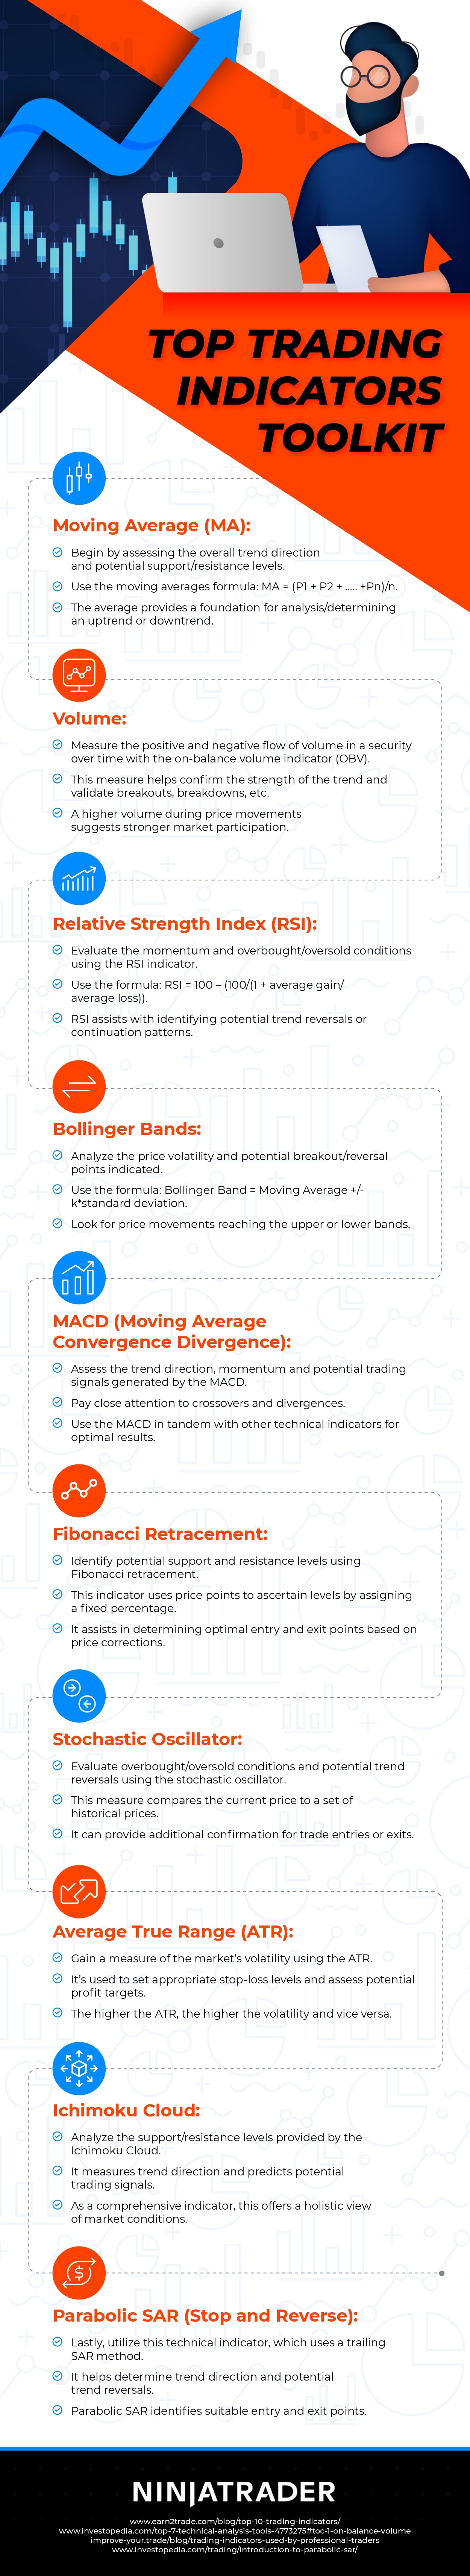
Attaining a professional level of day trading proficiency is no simple feat, demanding discipline, impeccable risk and money management skills, and a comprehensive working knowledge of the market. A profound understanding of various technical indicators is also indispensable to ascend to the top. These trading indicators provide technical analysis of market conditions and insights into market psychology, as well as the supply and demand of securities. They can even furnish reliable predictions based on intricate computations.
Among the most frequently observed indicators on a professional trader’s chart is the moving average. Another commonly used indicator is the on-balance volume (OBV), which measures the flow of both positive and negative volume in a security over time. Finally, the highly useful relative strength index (RSI) aids in gauging momentum and trend strength. This indicator plots recent price gains versus losses in a range between zero and 100, signifying overbought or oversold conditions for an asset.
When the RSI rises above 70, the asset is considered overbought, potentially signaling a decline and prompting a decision to sell. Conversely, falling below 30 signifies oversold conditions, suggesting a time to buy or allow existing stock to rally. The RSI is versatile, serving purposes such as measuring divergence and evaluating support and resistance levels, making it a valuable tool.
These examples provide just a glimpse into the top indicators that traders should incorporate into their toolkits. For a more in-depth understanding, please refer to the accompanying resource from NinjaTrader for further information.
Top Trading Indicators Toolkit from NinjaTrader, a futures trading platform